SENSOR Representative Sampling White Paper(PDF)
Sampling, or taking a subset of a larger population, is an analytical technique that has been in use for many years and is applied across most fields of study. Sampling of a chemical product can help improve yield, reduce waste, increase margins, and provide faster throughput.

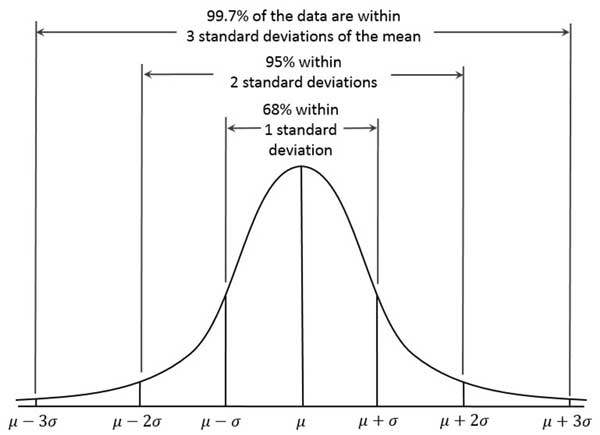
Sampling is a statistical process where a smaller set is collected from a much larger population of items for further processing; statistically speaking, the sample is expected to be an accurate representation of the overall population. If the sample randomly captures a cross-section of the larger population, the data being investigated in the sample will typically follow a Normal or Gaussian distribution. The term “Normal distribution” may ring a bell for some, as the plot of the sampled data-points follow the shape of a bell curve. A Normal distribution is such that approximately 68% of the data falls within 1 standard deviation, with 95% of the data falling within 2 standard deviations, and with about 99% of the data falling within 3 standard deviations.
In other words, if a process is operating correctly 68% of the particles in the sample should lie within 1 standard deviation from the average value of a particle within the population. This sampling methodology assumes a completely random approach to obtaining the sample; however, obtaining accurate samples from an actual process often presents many obstacles.
Getting a good sample is not as easy as you think
Obtaining a representative sample of a chemical process is very important in understanding the end-product, but can be very challenging in real world applications. Not only can you get statistical or sampling error through improper technique, but design errors can be carried through from the very beginning if the sampling system is improperly designed for the process. When a user determines the need to sample the process for quality, environmental, or for some other purpose, the sampling system must have careful engineering design so that the best “representative” sample is always achieved. Consequently, there are many ways poor engineering design can result in inaccurate samples.
The design of the system plays an important role
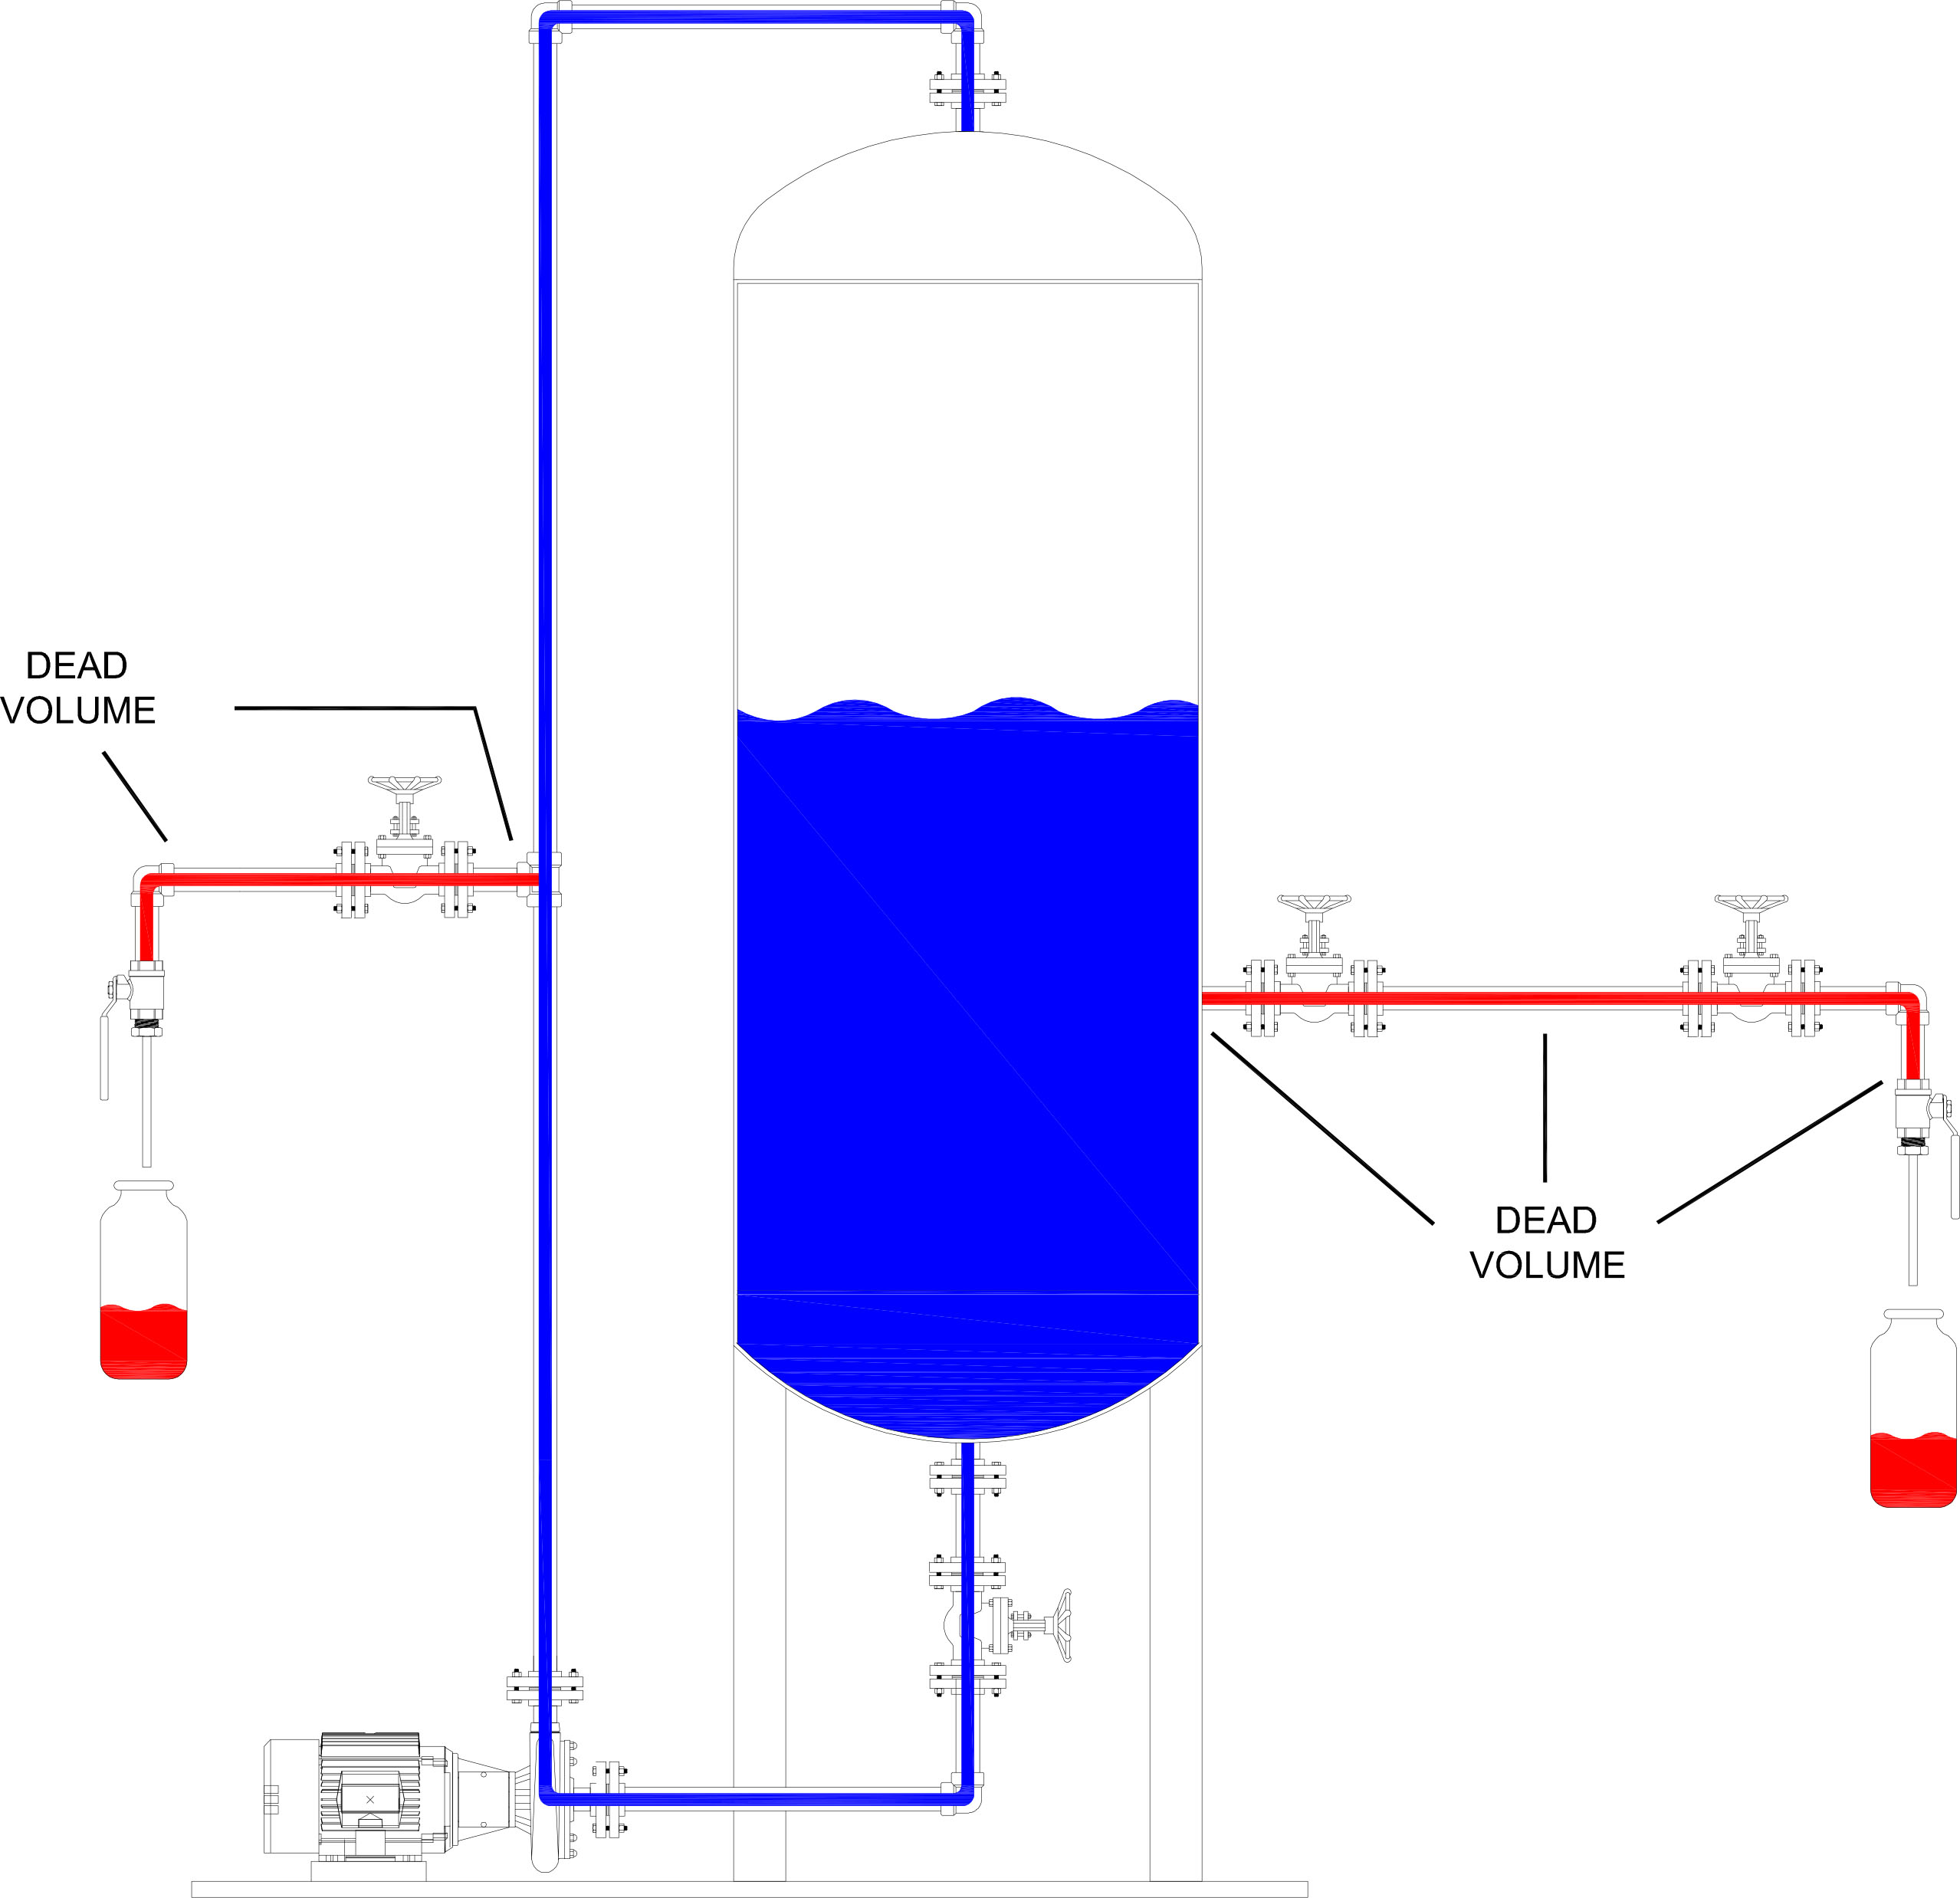
Simple design flaws can easily be created if careful consideration isn’t given to how a representative sample is collected. For example, tying the sample system return line back to the same location as the sample system supply line would be a novice mistake, as there would not be any differential pressure and hence, no effective flow. Typically, sampling system design includes what is known as a “fast loop” or “speed loop”: A fast loop is a sampling line where the sample supply pressure is higher than the process return side, creating flow. Installing inlet and outlet valves, which normally would be kept closed until the sample is taken, can cause product to accumulate in the dead space of the valve while it is closed. If an operator opens the valves and does not allow enough time to remove or flush the stagnant material, an inaccurate sample would be collected. In this case, the ultimate solution would be adding a return line back to process to continually flow the sample through the sampling system until there is some degree of certainty that the sample you are collecting is what is actually being produced in the main line at the moment the sample is being taken. Additionally, if the sample isn’t continuously flowing or there is residual product in dead space before the sampling valve, the system should be flushed and/or adequately purged to remove any debris or leftover matter before collecting a sample as this helps eliminate cross contamination.
So, how long should you wait before a sample is taken?
SENSOR Sampling Systems, a manufacturer of grab sampling systems located in Houston, Texas, has produced a handy flow lag calculator to assist in addressing this specific issue for sampling systems, to help make it easy for a user to determine how long they need to circulate process within the system before they are good to grab a sample.
In building the flow lag calculator, it is important to understand that many variables can affect the flow rate and, likewise, the required wait time until the sample is considered representative. For instance, many of the major components in a sampling system (e.g. blocking valves, sampling valves, tubing, fittings, etc.) can all produce restrictions to flow. When approximating the time required, we need to look at the Cv for all parts built into the system – the Cv values can then be used to calculate the flowrate through the system. From there, the wait time can be easily determined, just by knowing the lengths and size of the sampling system piping and with the previously determined flowrate.
Keeping sampling conditions similar to the production batch is another factor to consider when designing a sampling system. As an example, the media of one process may require. Take off lines with temperature-controlled heat trace, or another process might need a sampling vessel that can maintain pressure so that a material state change doesn’t occur. Sampling as close as possible to the production process point also helps to prevent problems. In the same way, purging of lines is a necessity because with some metals, residual material can actually influence test results from previous batches.
Sampling theory is well known within statistics; simply put, Sampling theory attempts to lower heterogeneity of a product’s composition until perfect homogeneity is achieved. Within sampling theory, Homogeneity is defined as the limit “of zero heterogeneity”. (Lars Petersen)
Moreover, Heterogeneity of a product is broken down into 2 components: constitutional, and distributed.
- Constitutional heterogeneity defines physical or chemical properties of a batch, whereas distributed heterogeneity defines the spatial properties, such as time or location within a batch or continuous stream. Constitutional heterogeneity can be reduced by changing the physical components of the stream or batch. To put it differently, sampling a flowing product mixture may require input modification to the individual components in order to reduce the final product’s constitutional heterogeneity. In reality, Constitutional heterogeneity can never be perfectly homogeneous because there can still be minute differences at the molecular level. By comparison, Constitutional heterogeneity will always be larger than distributed heterogeneity.
- Distributed heterogeneity can be reduced by sampling methods – Petersen postulates that 3 factors contribute to the magnitude of the distributed heterogeneity: constitutional heterogeneity (such as material type and size, etc.), the sample size being extracted and spatial distribution within the batch or stream (such as 2 minutes apart on a continuous batch, or located every 3 inches apart). (Lars Petersen)
Gather your process data
When designing a sampling system for a client, the engineer must become intimately familiar with the application and the process conditions under which it is being collected. To provide the highest degree of safety, The sampling system engineer will need to fully understand the operating conditions for the process, such as: Operating pressure, operating temperature, flowrate, viscosity, media being sampled, and the size of the lines being sampled from. Not only will they need to understand these process values, but the engineer will also need to understand specific company requirements with  regards to sampling. The company that the system is being designed for may have standards or requirements on how to sample their product in order to get a “true representative sample”. A P&ID is very beneficial for the design of the system and, typically, would be expected at the time it is being designed. In most cases, these diagrams would already identify the sampling points within the process with necessary process conditions, piping sizes, etc.
The vast majority of sampling systems will need a return line to either have the remaining uncollected sample go back to the process or momentarily flow to flare. The return line also helps by allowing residual material to be forced out of the system, or by allowing material for a batch to be pushed through until proper mixing, or other considerations that the customer may have, resulting in a good representative of the product. Identifying the location for fast loops will help the success of getting a representative sample; these fast loop locations should typically have a differential of 5 – 15 psig, but depending on viscosity or material makeup may require a higher differential pressure between the sample supply line and the sample return line. This, in turn, will help the material freely flow through the sampling station, preventing buildup or contamination over time and ensuring a representative sample is always ready to be collected.
To mitigate many of these potential design pitfalls, it helps to work with an engineering team that has experience specific to grab sampling. A client engineer may be familiar with the process desired for sampling, but may not have thought through all the design challenges to make the sampling system effective at capturing a true representative sample. Every process  has subtle differences from one line or from one plant to the next and these subtleties can create unforeseen problems over time if not properly anticipated. Grab sampling application design is not as easy as it sounds; it typically takes a very specific, custom approach to every application in order to ensure the best potential representative sample is obtained in the safest manner. A company with staff that have faced many of the hurdles associated with sampling is plays a pivotal role in the success of the overall system.
Works Cited
Kernler, Dan. File:Empirical Rule.PNG. 30 10 2014. 23 04 2018 <https://commons.wikimedia.org/wiki/File:Empirical_Rule.PNG>.
Lars Petersen, & Kim Esbensen. “Representative Process Sampling for Reliable Data Analysis – a Tutorial.” Journal of Chemometrics (2005): 625-647.
 Michael Bequette, P.E. – VP of Engineering, SOR Inc.
Michael Bequette has dual undergraduate degrees in Electrical Engineering, and Theoretical Physics from Kansas State University. He has a Master Degree in Electrical Engineering from the University of Kansas, and a Master of Business Administration from Park University. Michael has 23 years of experience in the oil and gas space, as well as aerospace, glass, pulp and paper, and water/wastewater. Michael is a licensed professional engineer in multiple states, holds 4 patents for fiber optic product development and capacitive fault location and is a senior member of IEEE.